这是一个创建于 1061 天前的主题,其中的信息可能已经有所发展或是发生改变。
audioFlux
audioFlux 是一个 Python 和 C 实现的库,提供音频领域系统、全面、多维度的特征提取与组合,结合各种深度学习网络模型,进行音频领域的业务研发。音频特征较为全面,支持移动端,提供尽可能细粒度、体系化的特征维。
- GitHub: https://github.com/libAudioFlux/audioFlux
- Documentation: https://audioflux.top/
Overview
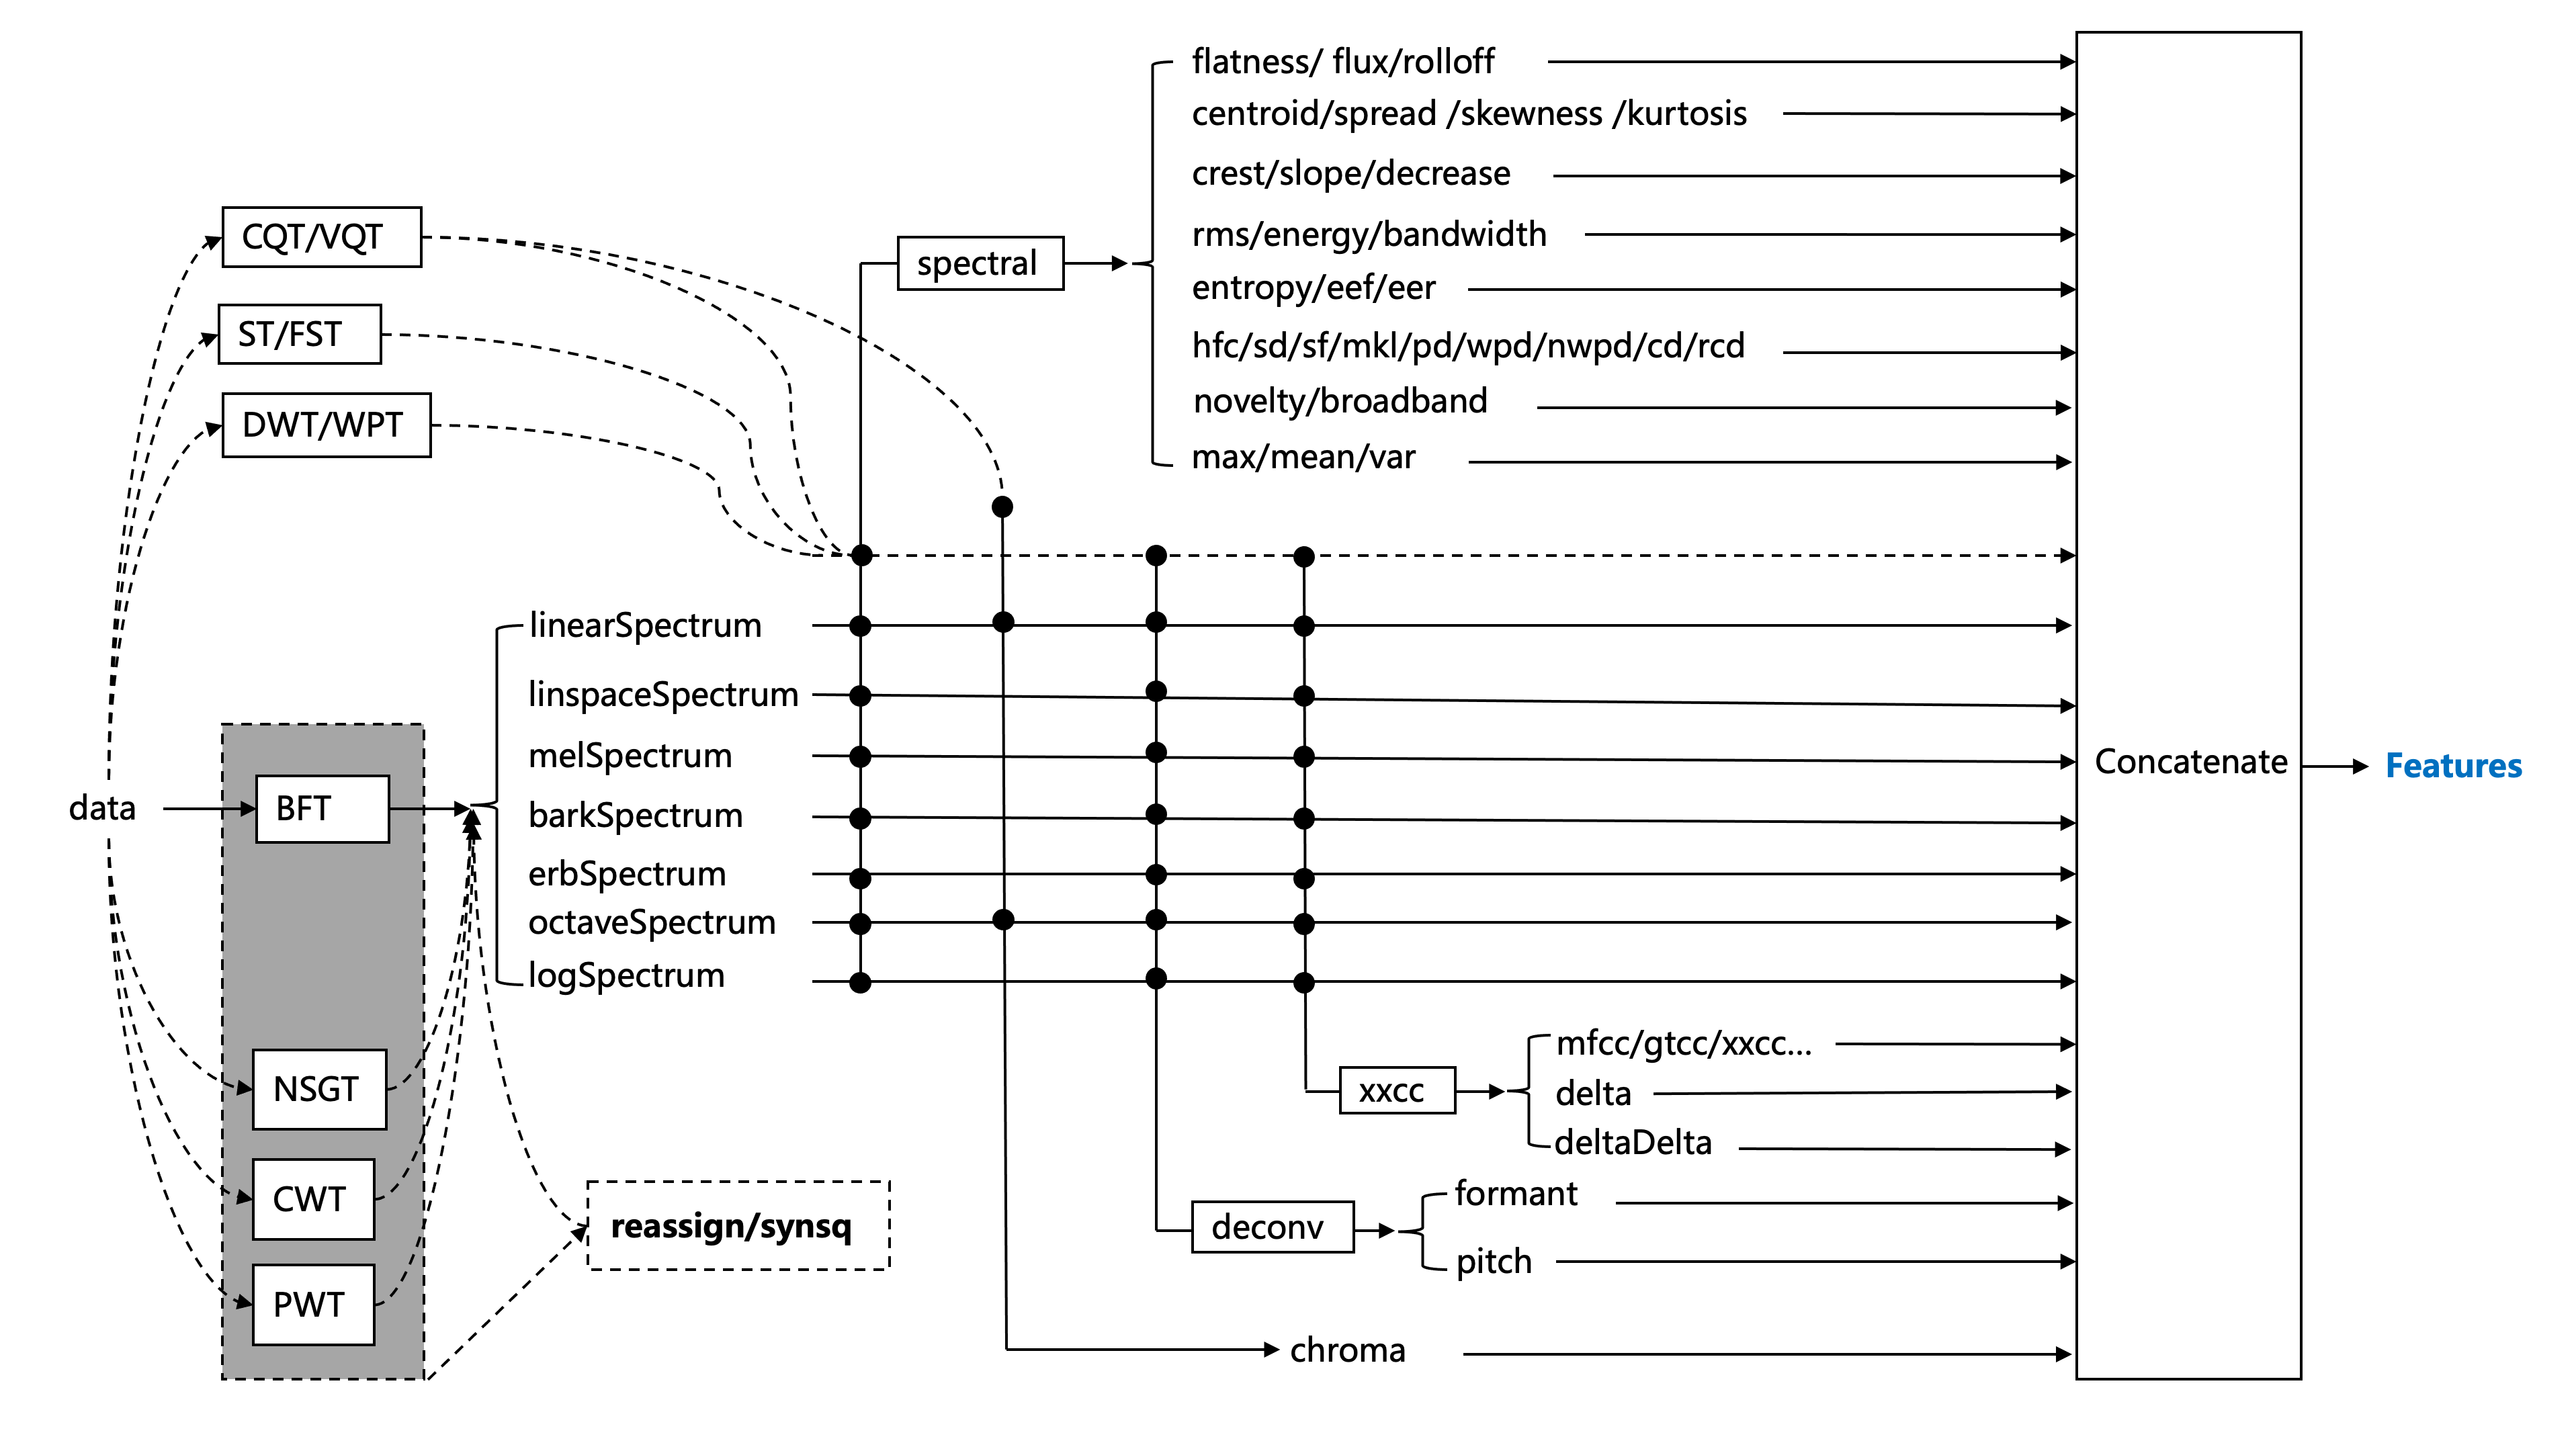
audioFlux 基于数据流设计。它在结构上解耦了每个算法模块,可以快速有效地提取多个维度的特征。以下是主要功能体系结构图。

可以使用多维特征组合,选择不同的深度学习网络训练,研究音频领域的各种任务,如 Classification 、Separation 、MIR 等。

QuickStart
pip install audioflux
import numpy as np
import audioflux as af

import matplotlib.pyplot as plt
from audioflux.display import fill_spec

# Get a 220Hz's audio file path
sample_path = af.utils.sample_path('220')

# Read audio data and sample rate
audio_arr, sr = af.read(sample_path)

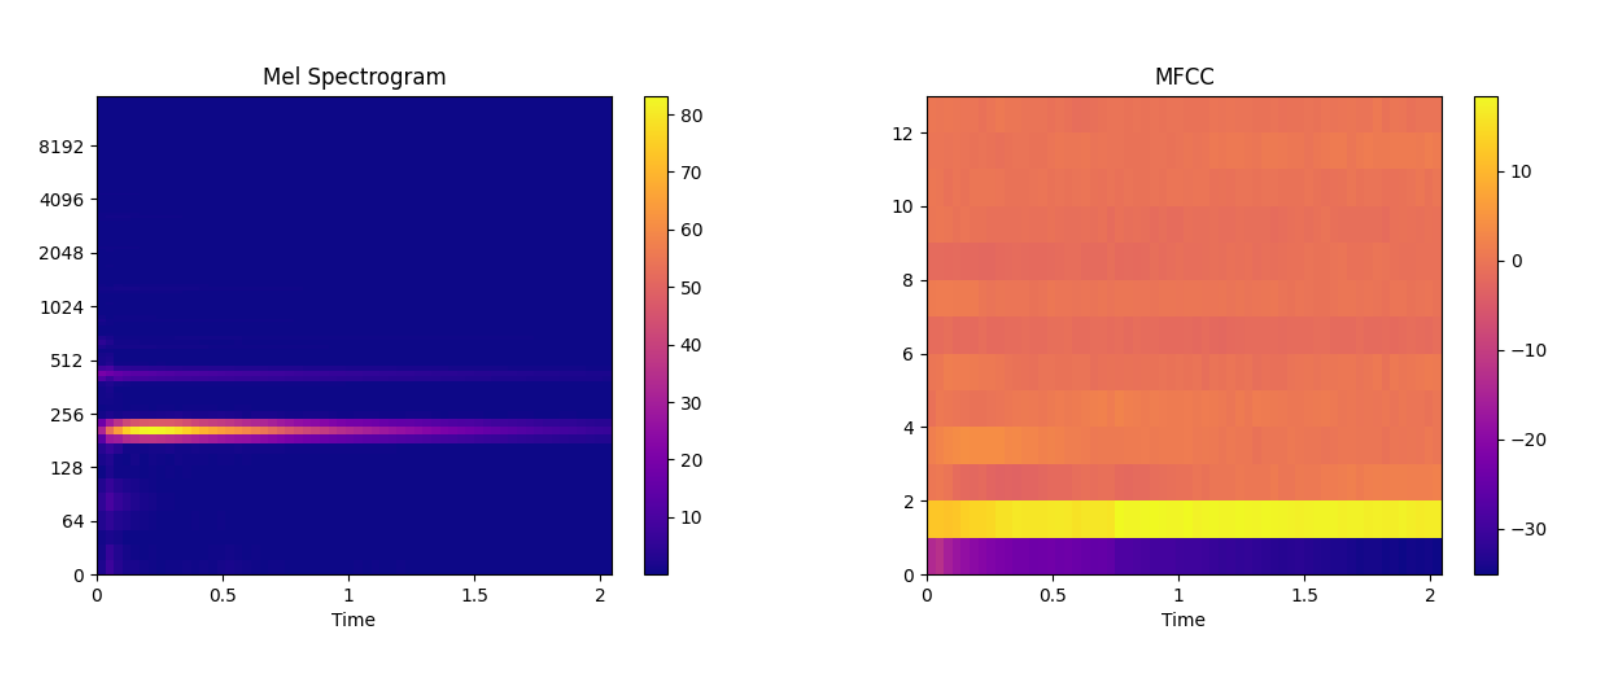
# Extract mel spectrogram
spec_arr, mel_fre_band_arr = af.mel_spectrogram(audio_arr, num=128, radix2_exp=12, samplate=sr)
spec_arr = np.abs(spec_arr)

# Extract mfcc
mfcc_arr, _ = af.mfcc(audio_arr, cc_num=13, mel_num=128, radix2_exp=12, samplate=sr)

# Display
audio_len = audio_arr.shape[0]
# calculate x/y-coords
x_coords = np.linspace(0, audio_len / sr, spec_arr.shape[1] + 1)
y_coords = np.insert(mel_fre_band_arr, 0, 0)
fig, ax = plt.subplots()
img = fill_spec(spec_arr, axes=ax,
                x_coords=x_coords, y_coords=y_coords,
                x_axis='time', y_axis='log',
                title='Mel Spectrogram')
fig.colorbar(img, ax=ax)

fig, ax = plt.subplots()
img = fill_spec(mfcc_arr, axes=ax,
                x_coords=x_coords, x_axis='time',
                title='MFCC')
fig.colorbar(img, ax=ax)

plt.show()

感兴趣的请给个 Star
Github: https://github.com/libAudioFlux/audioFlux 欢迎探讨关于音频相关的问题
更多实例
1
CMLab 2023 年 3 月 20 日
有 pitch 相关的 demo 吗
|
2
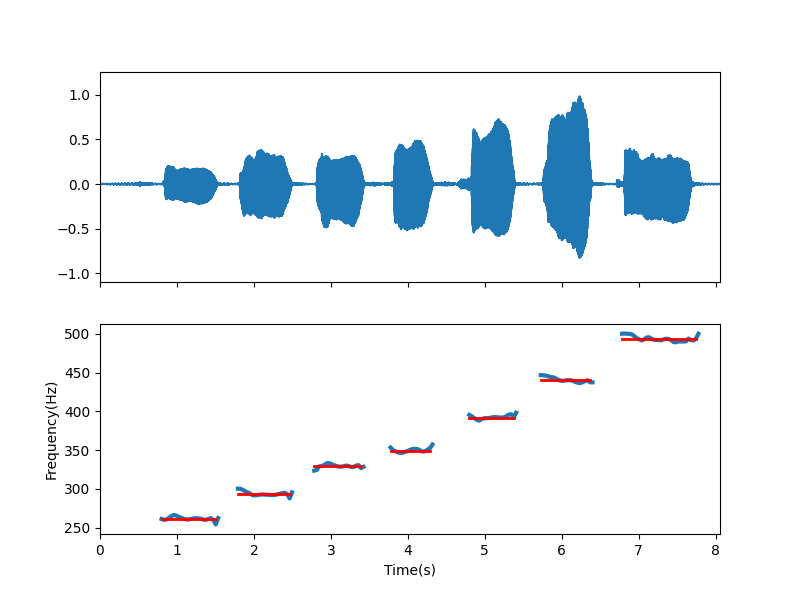
829939 OP @CMLab 你好,有音高估算的 demo 。
``` import numpy as np import audioflux as af from audioflux.type import PitchType import matplotlib.pyplot as plt from audioflux.display import fill_wave # Read audio data and sample rate audio_arr, sr = af.read(af.utils.sample_path('voice')) obj = af.Pitch(pitch_type=PitchType.YIN) fre_arr, value_arr1, value_arr2 = obj.pitch(audio_arr) fre_arr[fre_arr < 1] = np.nan # Display fig, ax = plt.subplots(nrows=2, figsize=(8, 6), sharex=True) times = np.arange(0, len(fre_arr)) * (obj.slide_length / obj.samplate) fill_wave(audio_arr, samplate=sr, axes=ax[0]) ax[1].xaxis.set_label_text("Time(s)") ax[1].yaxis.set_label_text("Frequency(Hz)") ax[1].plot(times, fre_arr, label='fre', linewidth=3) # set real plot real_fre_arr = np.zeros_like(fre_arr) real_fre_arr[25:48] = 261.6 real_fre_arr[56:78] = 293.7 real_fre_arr[87:107] = 329.6 real_fre_arr[118:135] = 349.2 real_fre_arr[150:169] = 392.0 real_fre_arr[179:200] = 440.0 real_fre_arr[212:243] = 493.9 real_fre_arr[real_fre_arr == 0] = np.nan ax[1].plot(times, real_fre_arr, color='red', label='fre', linewidth=2) plt.show() ```  |
3
xieren58 2023 年 3 月 20 日 已经 star 过了...
|
4
cnsouka 2023 年 3 月 20 日
感觉很厉害,已 star
|
5
PinkPumpkin 2023 年 3 月 20 日 via Android
这个相比 librosa 有什么特别的优势吗
|
6
CMLab 2023 年 3 月 20 日
@829939 运行报错, 不支持 m1 ``` libaudioflux.dylib (mach-o file, but is an incompatible architecture (have (x86_64), need (arm64e))```
|
8
829939 OP @CMLab 是用 pip 安装的吗? 之前编译时漏了 macOS arm 的支持,这两天会发布更新版本。
或者先使用源码自行编译可以支持 M1 芯片。 |
9
829939 OP @lbingl
librosa ,目前业界内常用的库,其过程命令式的接口实现设计,方便易用、易理解的同时,也加剧了其性能短板,大规模数据跑起来特别慢。 audioFlux ,音频特征较为全面,支持移动端,提供尽可能细粒度、体系化的特征维度和组合。算法使用 C 实现,性能要比 librosa 快很多。适合大规模特征提取。 |
10
PinkPumpkin 2023 年 3 月 20 日 via Android
@829939 谢谢,最近正好在做一个语音和深度学习相关的工作,我看看是不是能用上
|